Build plots using the outputs stored in the probsup object.
Usage
# S3 method for class 'probsup'
plot(x, ..., category = "perfo", level = "across")
Arguments
- x
An object of class
probsup.- ...
currently not used
- category
A string indicating which plot to build. See options in the Details section.
- level
A string indicating the information level to be used for building the plots. Options are
"across"for focusing on the probabilities across environments, or"within"to focus on the within-environment effects. Defaults to"across".
Details
The available options are:
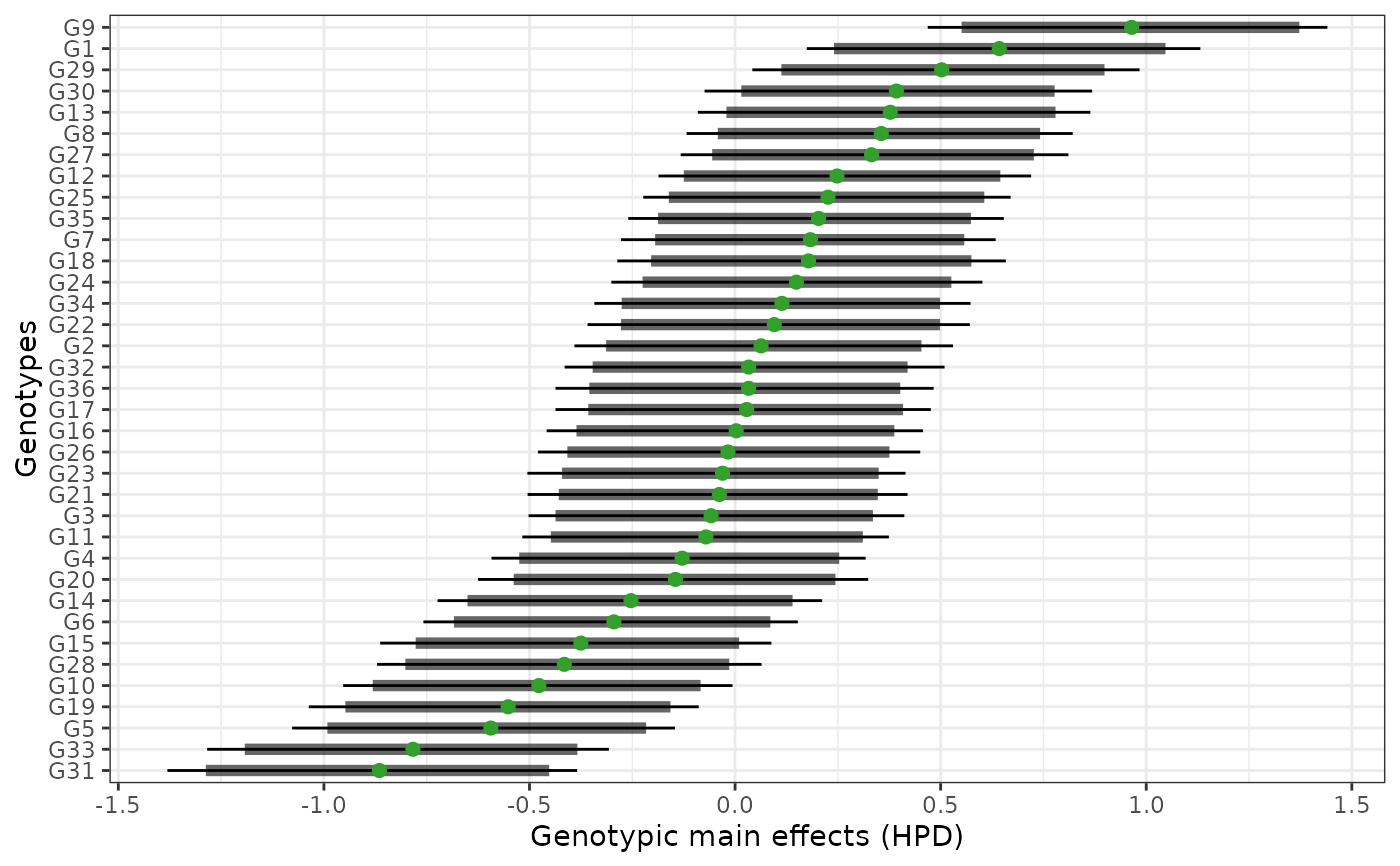
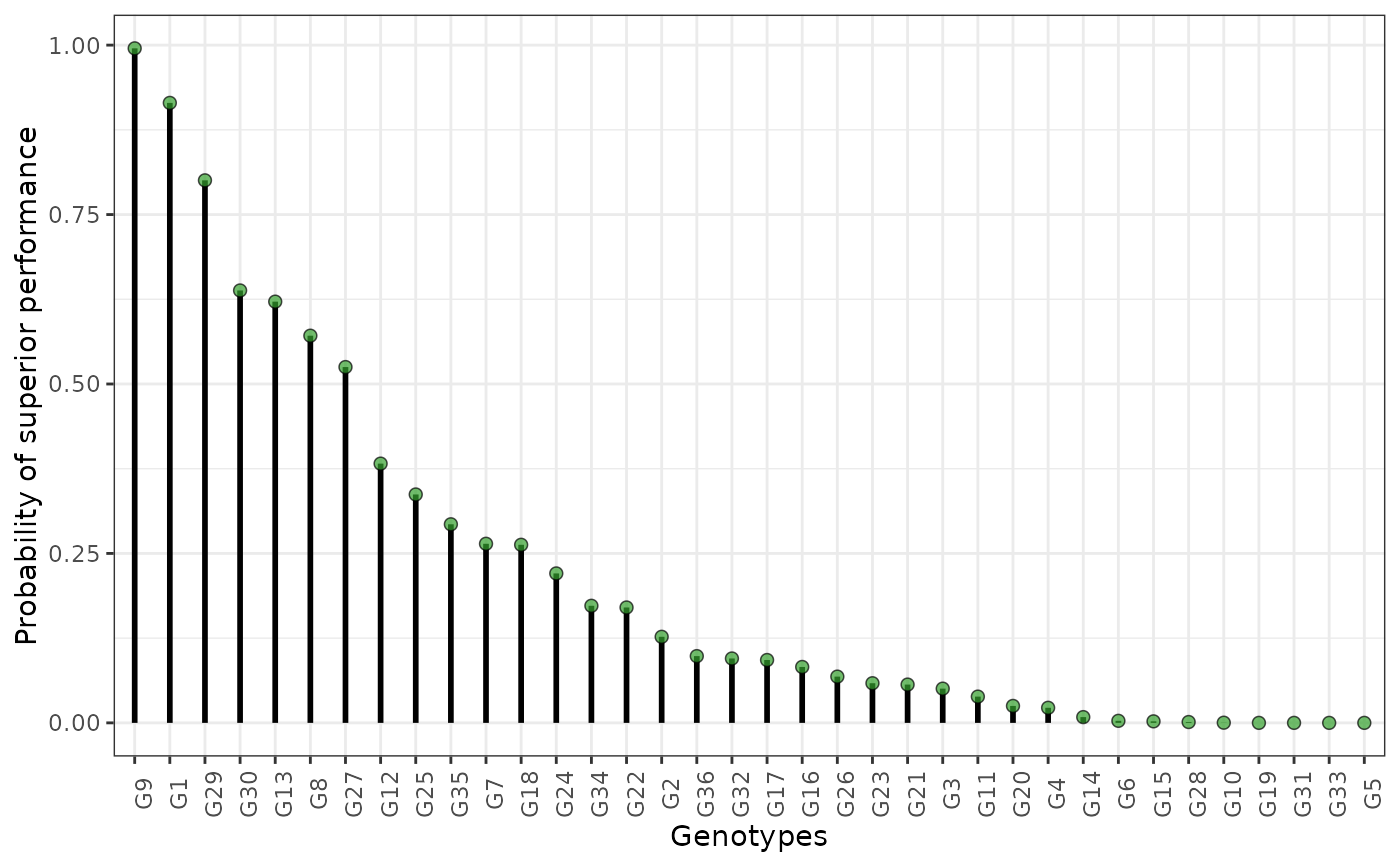
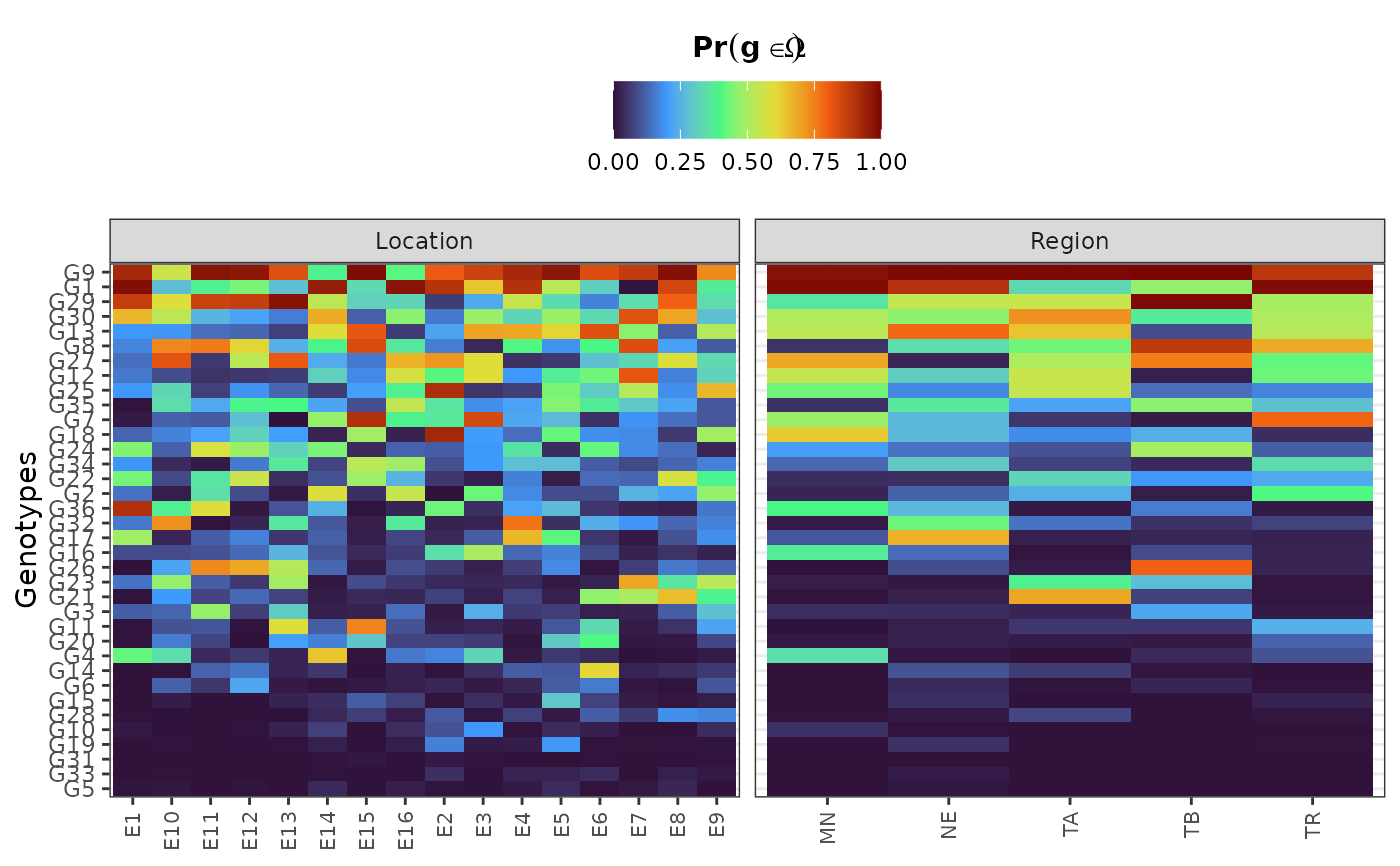
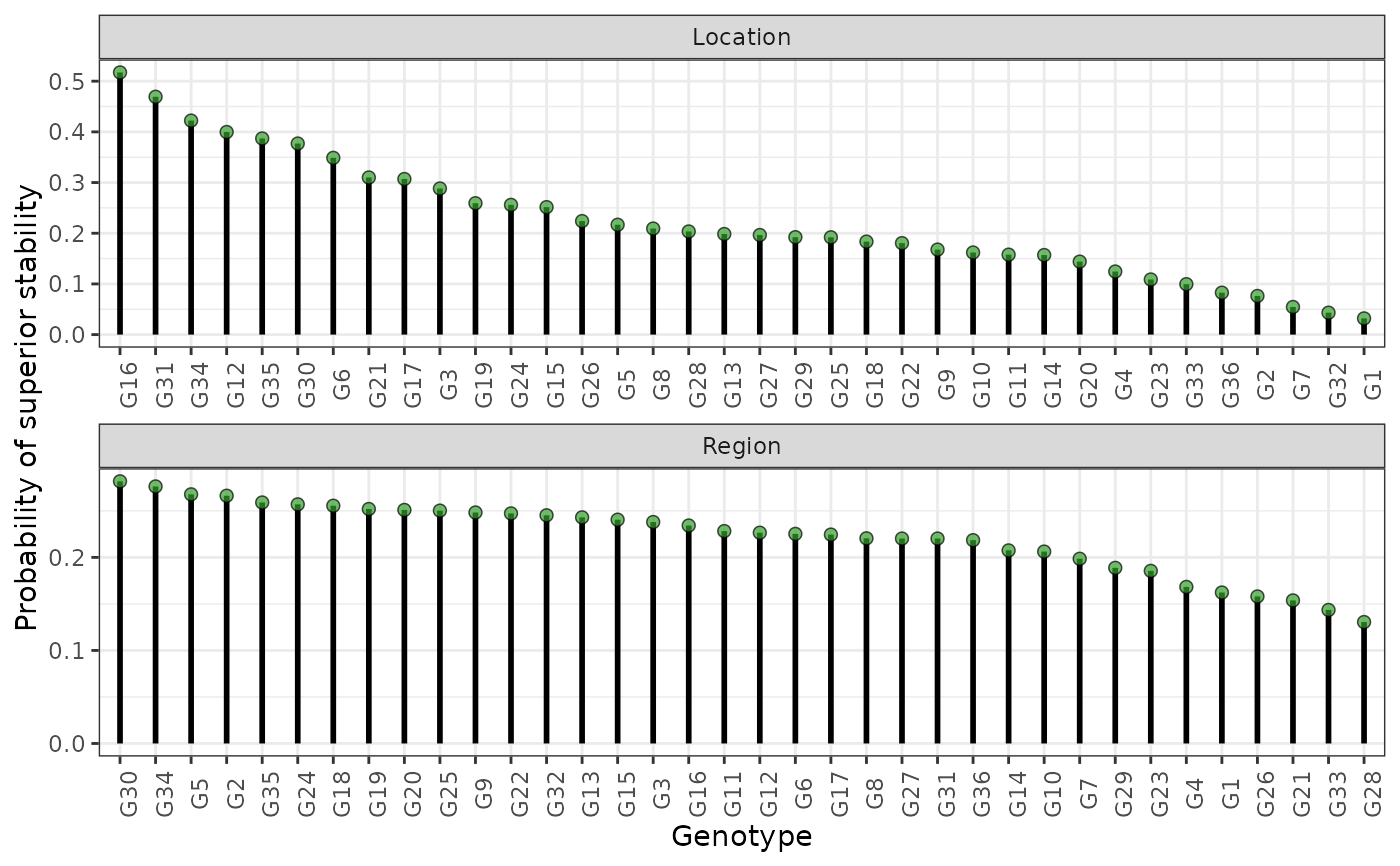
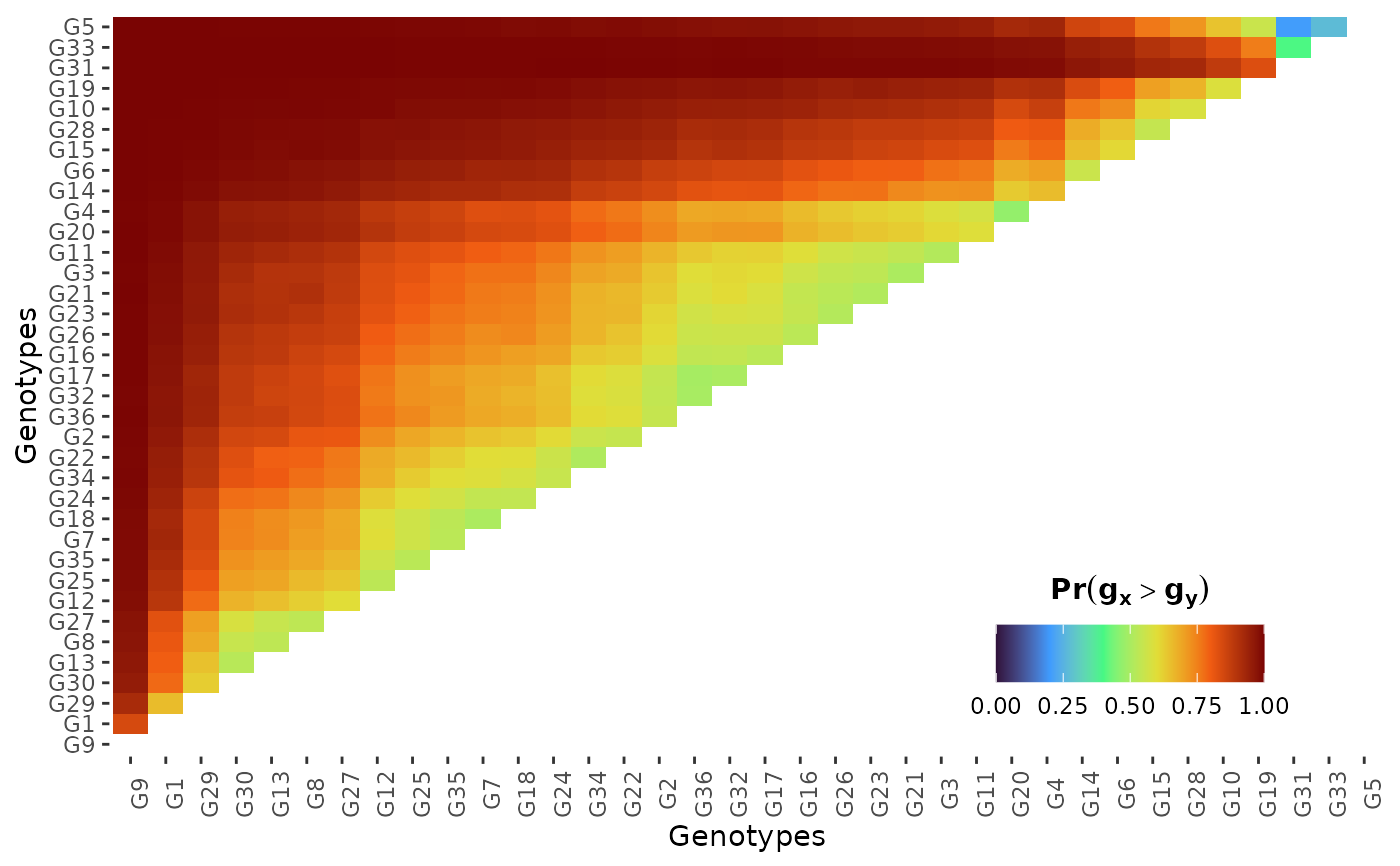
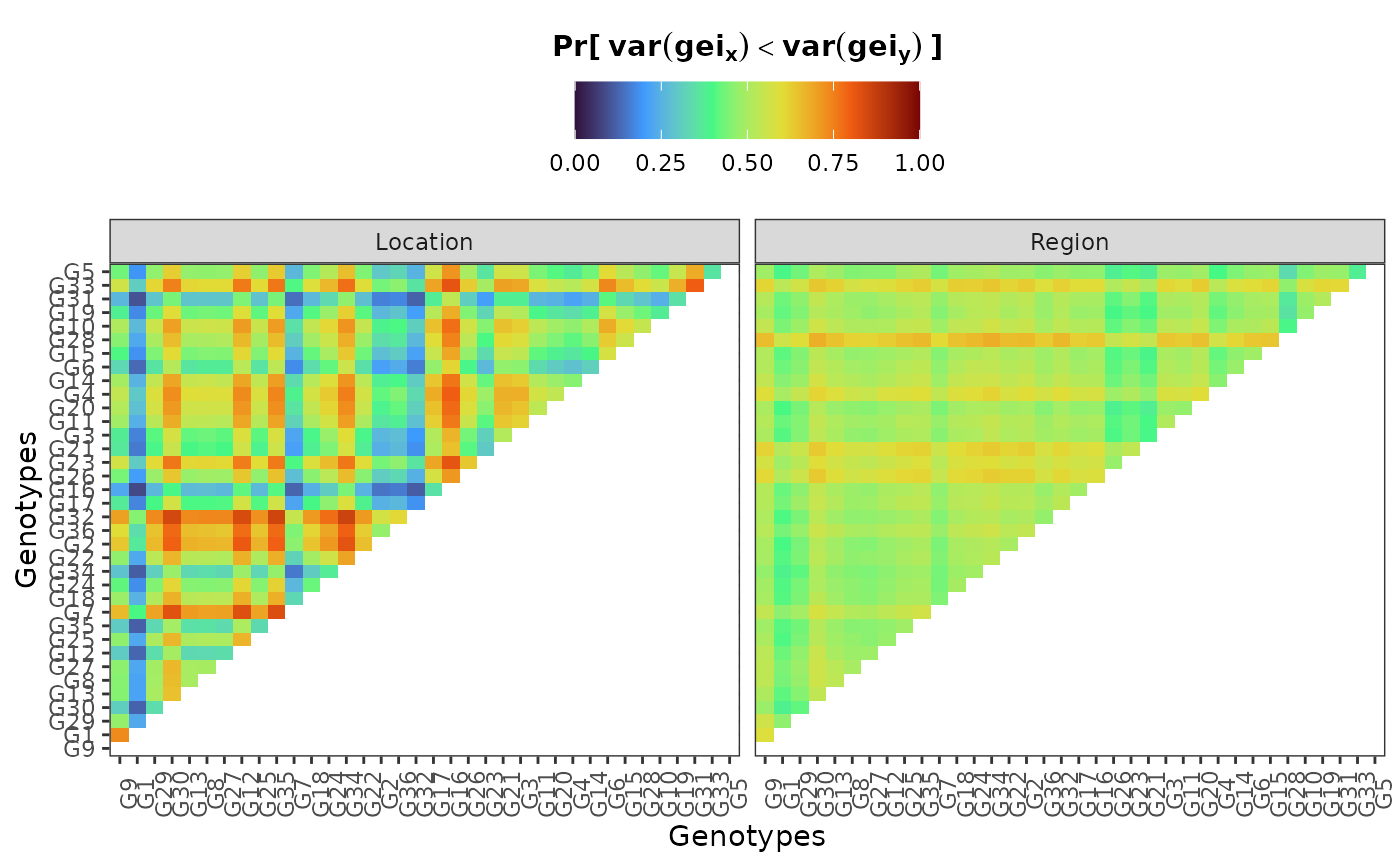
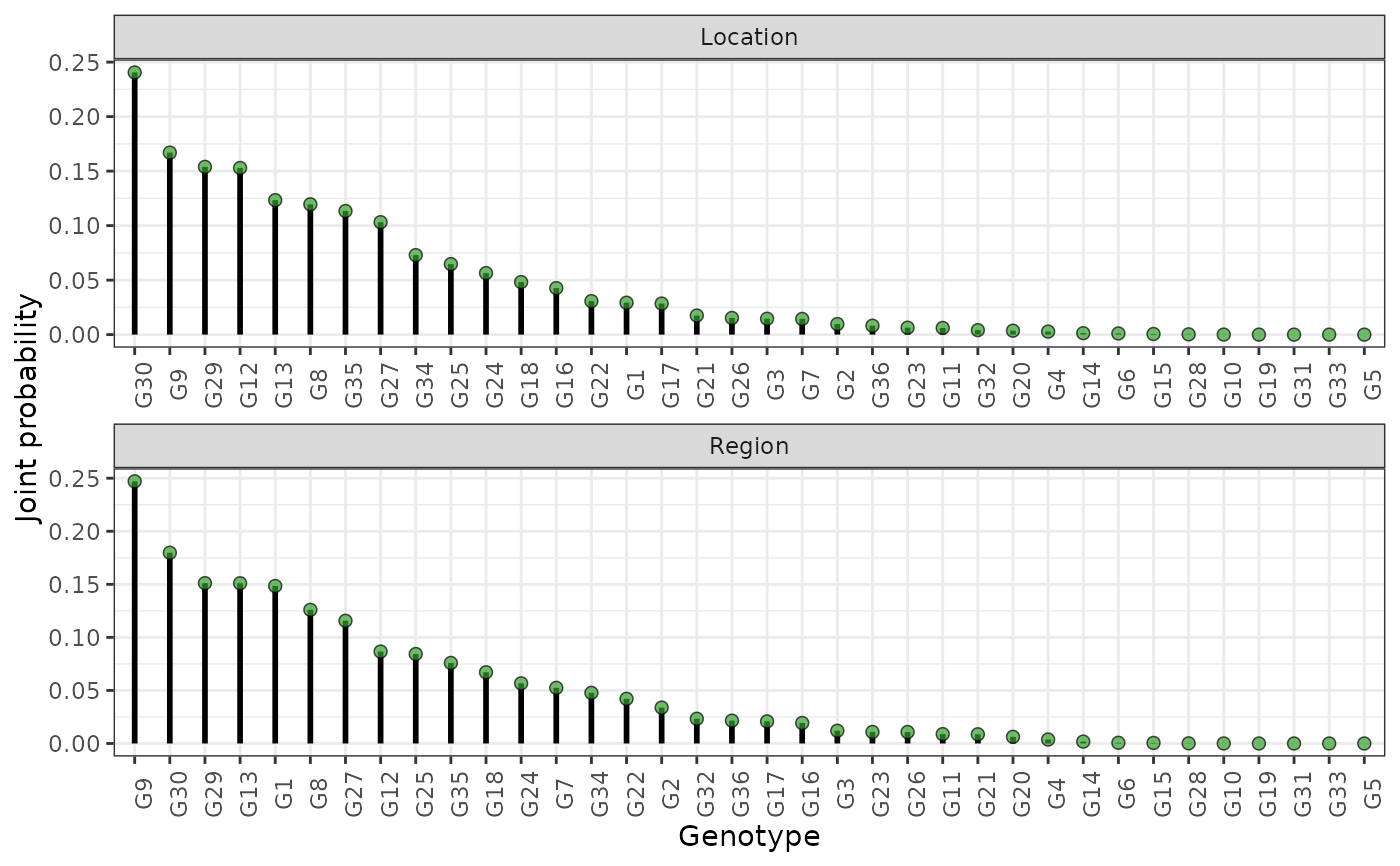
hpd: a caterpillar plot representing the marginal genotypic value of each genotype, and their respective highest posterior density interval (95% represented by the thick line, and 97.5% represented by the thin line). Available only iflevel = "across".perfo: iflevel = "across", a lollipop plot illustrating the probabilities of superior performance. Iflevel = "within", a heatmap with the probabilities of superior performance within environments. If a model withregand/oryearis fitted, multiple plots are produced.stabi: a lollipop plot with the probabilities of superior stability. If a model withregand/oryearis fitted, multiple plots are produced. Available only iflevel = "across". Unavailable if an entry-mean model was used inbayes_met.pair_perfo: iflevel = "across", a heatmap representing the pairwise probability of superior performance (the probability of genotypes at the x-axis being superior. to those on the y-axis). Iflevel = "within", a list of heatmaps representing the pairwise probability of superior performance within environments. If a model withregand/oryearis fitted, multiple plots (and multiple lists) are produced. Should this option is set, it is mandatory to store the outputs in an object. (e.g.,pl <- plot(obj, category = "pair_perfo", level = "within")) so they can be visualized one at a time. The optionlevel = "within"is unavailable if an entry-mean model was used inbayes_met.pair_stabi: a heatmap with the pairwise probabilities of superior stability (the probability of genotypes at the x-axis being more stable than those on the y-axis). If a model withregand/oryearis fitted, multiple plots are produced. Available only iflevel = "across". Unavailable if an entry-mean model was used inbayes_met.joint: a lollipop plot with the joint probabilities of superior performance and stability. Unavailable if an entry-mean model was used inbayes_met.
Examples
# \donttest{
mod = bayes_met(data = maize,
gen = "Hybrid",
loc = "Location",
repl = c("Rep","Block"),
trait = "GY",
reg = "Region",
year = NULL,
res.het = TRUE,
iter = 2000, cores = 2, chain = 4)
#> Warning: There were 3 divergent transitions after warmup. See
#> https://mc-stan.org/misc/warnings.html#divergent-transitions-after-warmup
#> to find out why this is a problem and how to eliminate them.
#> Warning: There were 999 transitions after warmup that exceeded the maximum treedepth. Increase max_treedepth above 10. See
#> https://mc-stan.org/misc/warnings.html#maximum-treedepth-exceeded
#> Warning: There were 1 chains where the estimated Bayesian Fraction of Missing Information was low. See
#> https://mc-stan.org/misc/warnings.html#bfmi-low
#> Warning: Examine the pairs() plot to diagnose sampling problems
#> Warning: The largest R-hat is 1.12, indicating chains have not mixed.
#> Running the chains for more iterations may help. See
#> https://mc-stan.org/misc/warnings.html#r-hat
#> Warning: Bulk Effective Samples Size (ESS) is too low, indicating posterior means and medians may be unreliable.
#> Running the chains for more iterations may help. See
#> https://mc-stan.org/misc/warnings.html#bulk-ess
#> Warning: Tail Effective Samples Size (ESS) is too low, indicating posterior variances and tail quantiles may be unreliable.
#> Running the chains for more iterations may help. See
#> https://mc-stan.org/misc/warnings.html#tail-ess
outs = extr_outs(model = mod,
probs = c(0.05, 0.95),
verbose = TRUE)
#> -> Posterior effects extracted
#> -> Variances extracted
#> -> Maximum posterior values extracted
#> -> Posterior predictive checks computed
#> 3 of 4000 iterations ended with a divergence (0.075%).
#> Try increasing 'adapt_delta' to remove the divergences.
#> 999 of 4000 iterations saturated the maximum tree depth of 10 (24.975%).
#> Try increasing 'max_treedepth' to avoid saturation.
#> E-BFMI indicated possible pathological behavior:
#> Chain 2: E-BFMI = 0.192
#> E-BFMI below 0.2 indicates you may need to reparameterize your model.
results = prob_sup(extr = outs,
int = .2,
increase = TRUE,
save.df = FALSE,
verbose = FALSE)
plot(results, category = "hpd")
 plot(results, category = "perfo", level = "across")
 plot(results, category = "perfo", level = "within")
 plot(results, category = "stabi")
 plot(results, category = "pair_perfo", level = "across")
 plwithin = plot(results, category = "pair_perfo", level = "within")
plot(results, category = "pair_stabi")
plwithin = plot(results, category = "pair_perfo", level = "within")
plot(results, category = "pair_stabi")
 plot(results, category = "joint")
 # }
# }